Difference between Sample variance & Population variance
Explanation
In Statistics the term sampling refers to selection of a part of aggregate statistical data for the purpose of obtaining relevant information about the whole. The aggregate or whole of statistical information on a particular character of all the members covered by the investigation is called ‘population’ or ‘universe’. (Das, N.G., 2010). The selected part of the population which is used to obtain the characteristics of the population or universe is termed as ‘sample’. The population is taken to be made of individual units or members, and some of the units are included in the sample. Total number of units of the population is called population size, and that of the sample is called sample size. Population and sample can be finite or infinite and similarly they can be existent or hypothetical.
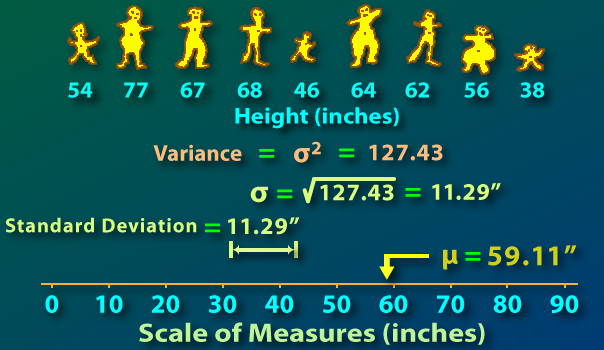
Variance: Variance is a numerical value that shows how widely the individual figures in a set of data distribute themselves about the mean. That is how far each number is from the mean, and thus from each other. A variance of zero value means all the data are identical. More the variance, more are the values spread out about mean, hence from each other. Less the variance, less are the values spread out about mean, hence from each other, and variance can’t be negative.
Difference between population variance and sample variance
The main difference between population variance and sample variance relates to calculation of variance. Variance is calculated in five steps. First mean is calculated, then we calculate deviations from the mean, and thirdly the deviations are squared, fourthly the squared deviations are summed up and finally this sum is divided by number of items for which the variance is being calculated. Thus variance= Σ(xi-x-)/n. Where xi = ith. Number, x- = mean and n = number of items..
Now, when the variance is to be calculated from population data, n is equal to the number of items. Thus if variance in blood pressure of all the 1000 people is to be calculated from data on blood pressures of all the 1000 people, then n = 1000. However when the variance is calculated from sample data 1 is to be deducted from n before dividing the sum of the squared deviations. Thus in the above example if sample data have 100 items, the denominator would be 100 – 1 = 99.
Due to this, the value of variance calculated from sample data is higher than the value that could have been found out by using population data. The logic of doing that is to compensate our lack of information about the population data. It is impossible to find out variance of heights in human beings, for our absolute lack of information about heights of all living human beings, not to talk of the future. Even if we take one moderate example, like population data on heights of all the living men in US it is physically possible, but the cost and time involved in this would defeat the purpose of its calculation. This is the reason sample data are taken for most of the statistical purposes, and this is accompanied by lack of information about majority of data. In order to compensate this, the value of variance and standard deviation, which is squared root of variance are higher in case of sample data than variance from population data.
This acts as an automatic shield for the analysts and decision makers. The logic applies for decisions on capital budgeting, personal and business finance, construction, traffic management , and many applicable fields. This helps the stake holder to be on the safe side while taking decision or for other inferences.
Summary: Population variance refers to the value of variance that is calculated from population data, and sample variance is the variance calculated from sample data. Due to this value of denominator in the formula for variance in case of sample data is ‘n-1’, and it is ‘n’ for population data. As a result both variance and standard deviation derived from sample data are more than those found out from population data.
- Difference Between Vascular Cambium and Cork Cambium - November 1, 2023
- Difference Between DevOps and Developer - September 10, 2023
- Difference Between Acute Gastritis and Chronic Gastritis - April 3, 2023
Search DifferenceBetween.net :
Leave a Response
References :
[0]http://www.animatedsoftware.com/statglos/statglos.htm#standard_deviation