Difference between Parameter and Statistic
What is Parameter?
A parameter is a value that describes some aspect of a population. A parameter may be very difficult to determine if not impossible, especially in a large population. This is where samples and statistics come into play.
However, a parameter can be determined in a very small population where every individual can be located with absolute certainty, for instance in a totally captive population.
In this case you can calculate a parameter directly if all individuals can be located and measured without missing a single individual.
For instance, if you have an aviary into which you recently placed 100 birds, and you are interested in the average size of the birds, you can literally catch every individual bird to measure.
Then you can calculate the average size for this entire population.
Often though we are interested in measuring some value of a population that exists in the wild where we can’t find and measure every individual, so we can only estimate a parameter.
For any parameter that one wishes to measure within a population there will be a corresponding statistic that can be measured based on a sample.
A normal bell-shaped curve of a population can be characterized by two parameters, the average (mean) and amount of variation (indicated by the variance and standard deviation).
These parameters are indicated with these symbols: µ for mean, σ2 for variance, and σ for standard deviation. The parameter that is used to indicate the total size of the population is indicated by a N.
This is for a population. We use statistics to attempt to approximate these values.
What is Statistic?
A statistic is a value that is an estimate of a parameter. A statistic is based on a sample. It is calculated from a sample taken from a population.
Sampling is a way to collect information or data about a population without actually counting or measuring every individual in the population.
Sampling is often necessary since it is often impossible to measure or count every individual within a population since populations are often large and it may be hard to find every individual.
For example if you want to measure the average size of a tiny bird in a forest for instance. If this bird is abundant, small and hard to find because of all the vegetation, then the only way to get the actual population average would be to catch every single bird and measure each one. Since this is impossible you have to use a sampling program.
Birds are caught using mist nets but these can only be placed in certain areas, so not all birds will fly into them and get caught. This means you can only estimate the size based on catching a certain number (a sample) of the actual population.
You can use statistics to estimate your confidence in the estimation of the population parameter. This is done using confidence intervals, and statistics such as variance and standard deviation.
The sample is thus only one part of a population since it is often impossible to calculate a value based on every individual that makes up a population. One has to make assumptions about the population and assume that the sample represents the population in some way.
To estimate the mean and standard deviation when we use statistics we use the symbols: x̅ for the mean, s2 for the variance and s for the standard deviation. The statistic used to indicate the total size of a sample is given by n.
These values are calculated from a sample which is assumed to represent the population.
Difference between Parameter and Statistic
Definition:
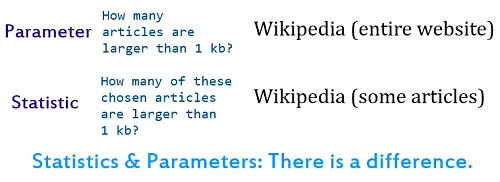
A parameter is a descriptive measure of a population while a statistic is a descriptive measure of a sample.
Population:
A statistic of a sample is used as an estimate of a population while a parameter is the actual value found in a population.
Measure:
A parameter may be impossible to measure while a statistic can always be measured.
Symbol:
The parameter average or mean for a population is indicated with µ while it is indicated with x̅ as a statistic for a sample.
Parameter:
The parameter variance for a population is indicated with σ2 while it is indicated with s2 as a statistic for a sample.
Standard deviation:
The parameter standard deviation for a population is indicated with σ while it is indicated with s as a statistic for a sample.
Population Size:
The parameter for the size of a population is given by N while the statistic representing the size of a sample is given by n.
Table comparing the difference between Parameter and Statistic
PARAMETER |
STATISTIC |
| Descriptive measure of a population | Descriptive measure of a sample |
| Actual value in the population | Estimate of a value in the population |
| Not always possible to measure | Always possible to measure |
| Parameter average or mean is indicated with µ | Statistic average or mean is indicated by x̅ |
| The variance is indicated by σ2 | The variance is indicated by s2 |
| Standard deviation is indicated by σ | Standard deviation is indicated by s |
| Total size of population is indicated by N | Total size of sample is indicated by n |
Summary of difference between Parameter and Statistic:
- A parameter is a descriptive value of some attribute of a population. It is the actual value.
- A statistic is a descriptive value of a sample of a population. It is an estimate of the population parameter.
- Parameters often can’t be calculated, especially in the wild where there are too many individuals and locating all individuals is not possible.
- A sample using statistics is therefore used to obtain an estimate of the population parameters.
- How close the statistic comes to the actual parameter can be tested via other statistical methods such as confidence limits.
- A parameter can be calculated in a small, closed population in which every individual can be located and measured.
- Different symbols are used in statistics to indicate a parameter versus a statistic.
- For instance, the parameter mean is indicated by µ while the statistic mean is indicated by x̅.
- Difference Between Rumination and Regurgitation - June 13, 2024
- Difference Between Pyelectasis and Hydronephrosis - June 4, 2024
- Difference Between Cellulitis and Erysipelas - June 1, 2024
Search DifferenceBetween.net :
1 Comment
Leave a Response
References :
[0]Barbara Illowsky, Barbara, and Susan Dean. Introductory Statistics.
[1]Houston: Rice University, 2017. Print.
[2]Sokal Robert R., and F. James Rohlf. Biometry: The Principles and Practices of Statistics in Biological Research, 3rd edition. New York: W.H. Freeman, 1994. Print.
[3]Merriam-Webster. “Statistic”. Dictionary. Merriam-Webster, 2017, https://www.merriam-webster.com/dictionary/statistic
[4]"Image Credit: https://commons.wikimedia.org/wiki/File:Statistical-Terminology-Why-Does-Nobody-Understand-Me.png"
Thanks for uploading this answer. It is very helpful.