Difference Between Dispersion and Skewness
The degree of variations is often expressed in terms of numerical data for the sole purpose of comparison in statistical theory and analysis. We normally calculate a single figure to represent the entire set of data, which is called an “average”. However, it does not specify any particular way to determine the composition of series. Because of which additional measures are required to enlighten us on how items vary from one another or around the average. To understand the much detailed concepts of quantitative analysis in statistics we use measures of dispersion and skewness. Dispersion is a measure of range of distribution around the central location whereas skewness is a measure of asymmetry in a statistical distribution.
What is Dispersion?
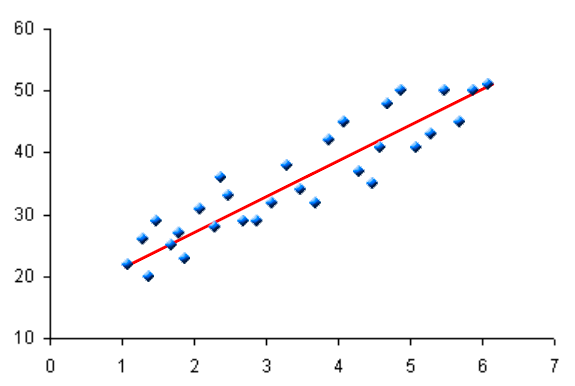
In statistics, dispersion is a measure of how distributed the data is meaning it specifies how the values within a data set differ from one another in size. It is the range to which a statistical distribution is spread around a central point. It mainly determines the variability of the items of a data set around its central point. Simply put, it measures the degree of variability around the mean value. The measures of dispersion are important to determine the spread of data around a measure of location. For example, the variance is a standard measure of dispersion which specifies how the data is distributed about the mean. Other measures of dispersion are Range and Average Deviation.
What is Skewness?
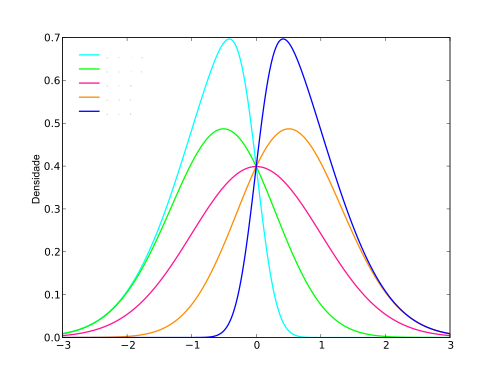
Skewness is a measure of asymmetry of distribution about a certain point. A distribution may be mildly asymmetric, strongly asymmetric, or symmetric. The measure of asymmetry of a distribution is computed using skewness. In case of a positive skewness, the distribution is said to be right-skewed and when the skewness is negative, the distribution is said to be left-skewed. If the skewness is zero, the distribution is symmetric. Skewness is measured on the basis of Mean, Median, and Mode. The value of skewness can be positive, negative, or undefined depending on whether the data points are skewed to left, or skewed to the right.
Difference between Dispersion and Skewness
-
Definition of Dispersion vs. Skewness
In statistical terms and probability theory, dispersion is the size of the range of values for a random variable or its probability distribution. It describes a range to which a distribution is stretched or spread. Simply put, it is a measure to study the variability of the items. Skewness, on the other hand, is a measure of the asymmetry in a statistical distribution of a random variable about its mean. The value of skewness can be both positive and negative, or sometimes undefined. Simply put, asymmetric distributions are said to be skewed
-
Measures of Dispersion vs. Skewness
The measures of dispersion mean the extent to which the variations are off-balanced from their central value. More precisely, it measures the degree of variability in a variable’s value around the mean value. Dispersion indicates the spread of the data. The measures of skewness mean how asymmetric the distribution is and determines whether data points are skewed to the right or to the left. If the distribution is said to be skewed to the left, then the value is negative and the value is positive if the distribution is skewed to the right.
-
Calculation of Dispersion vs. Skewness
Dispersion is calculated on the basis of certain average. It is a statistical calculation which measures the degree of variation and there are many different ways to calculate dispersion, but the two of the most common are range and average deviation. Range is the difference between the largest and the smallest values in a set of data, whereas average deviation is the average of the absolute values of the deviations of the functional values from a central point. Skewness, on the other hand, is calculated on the basis of Mean, Median, and Mode. If the mean is greater than the mode, you have a positive skew and in case the mean is less than the mode, you have a negative skew. Additionally, the distribution has a zero skew in case of a symmetric distribution.
-
Applications of Dispersion vs. Skewness
Dispersion is mainly used to describe the relationship between a set of data and determine the degree of variation of the values of data from their average value. Statistical dispersion can be used for other statistical methods such as Regression Analysis, which is a process used to understand the relationship among variables. It can also be used to test Reliability of Average. Skewness, on the other hand, deals with the nature of distribution in a set of data. It is extremely helpful when it comes to economical analysis in finance sector which involves a large set of data such as asset returns, stock prices, etc.
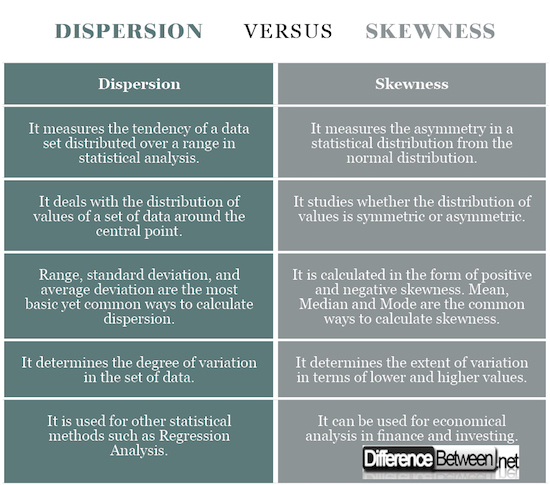
Dispersion vs. Skewness: Comparison Chart
Summary of Dispersion vs. Skewness
Both are the most common terms used in statistical analysis and probability theory to characterize a data set involving a huge massed of numerical data. Dispersion is a measure to compute the variability in the data or to study the variations of the data among themselves or around its average. It mainly deals with the distribution of values of data in a set around its central point. It can be measured in a number of ways, out of which Range and Average Deviation are the most common. Skewness is used to measure asymmetry from the normal distribution in a data set meaning the degree to which the distribution is off-balanced around the mean.
- Difference Between Caucus and Primary - June 18, 2024
- Difference Between PPO and POS - May 30, 2024
- Difference Between RFID and NFC - May 28, 2024
Search DifferenceBetween.net :
3 Comments
Leave a Response
References :
[0]Bulmer M.G. Principles of Statistics. Chelmsford, Massachusetts: Courier Corporation, 1979. Print
[1]Srivastava U.K., et al. Quantitative Techniques for Managerial Decisions. Mumbai: New Age International, 1989. Print
[2]Panaretos, Victor M. Statistics for Mathematicians: A Rigorous First Course. Basel, Switzerland: Birkhäuser, 2016. Print
[3]Image credit: https://upload.wikimedia.org/wikipedia/commons/d/de/Dispersion-con-regresion.png
[4]Image credit: https://upload.wikimedia.org/wikipedia/commons/thumb/8/8a/Skew_normal_densities_-_pt.svg/500px-Skew_normal_densities_-_pt.svg.png
Very nice sir
nice one e .,.,.,thnxx. alot.
Thank u for giving more information