Difference Between Unimodal and Bimodal Distribution
We encounter random variables every single day in every aspect of our life. These random variables play a crucial role in most of the field of study including chemistry, engineering, and physics, and most importantly in management and social sciences. These are analyzed and measured in terms of their probabilistic and statistical properties, a fundamental feature of which is the distribution function. In statistics, when we use the term distribution, we usually refer to probability distribution.
A distribution shows the possible values for a variable and the frequency of their occurrence. The first feature of a distribution of data for a variable is its modality, which refers to the value or values of the variable that occur most often in a set of data. Simply put, the modality is determined by the number of peaks a distribution contains. The modality of a distribution can be either Unimodal or bimodal depending on the frequency of the occurring values. Let’s take a brief look at unimodal and bimodal distributions and try to understand the key differences between the two.

What is a Unimodal Distribution?
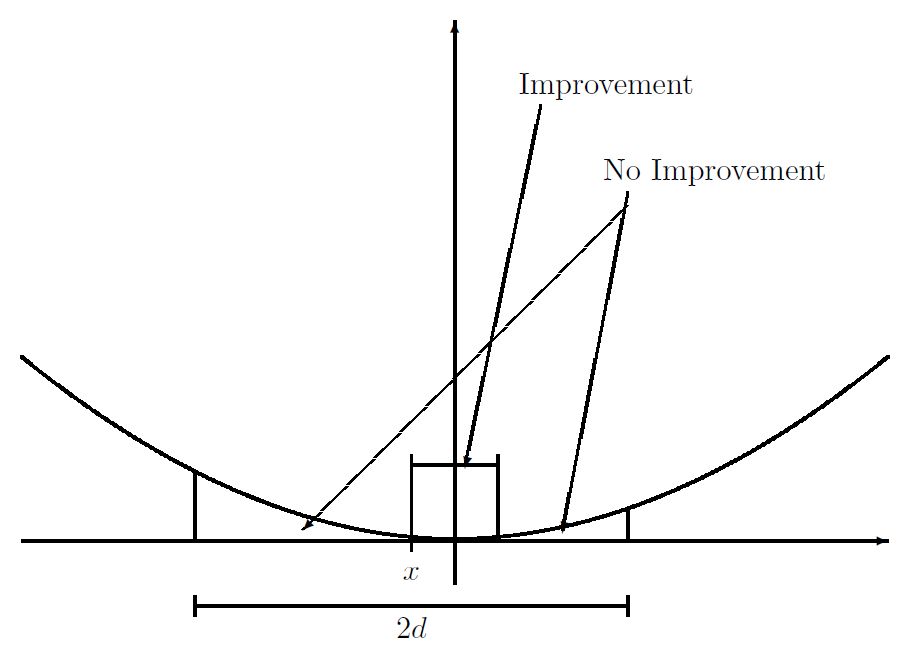
Unimodal Distribution, as the name suggests, is a single peaked distribution which means one value occurs with the greatest frequency than the other values. Distributions often have a clear peak to their shape. A unimodal distribution is a distribution with a single clearly visible peak or a single most frequent value. This means the distribution’s shape has only one main high point. The values increase up to that point after which the values start to decrease. The most common example of unimodal distribution is normal distribution. Sometimes the high point is in the center, while sometimes it peaks to the right or to the left. The mode refers to the most frequently observed value of the data. Unimodal distribution cannot be necessarily symmetric; they can very well be asymmetric or skewed distribution. Left skewed is when the mean is to the left whereas right skewed distribution is when the mean is to the right.

What is a Bimodal Distribution?
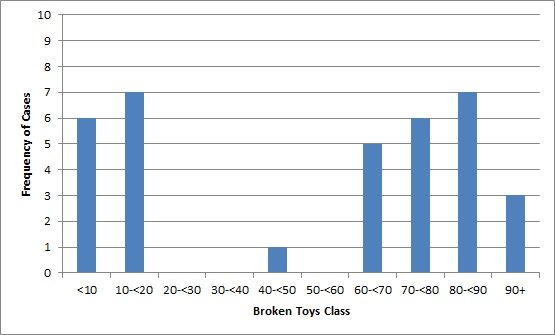
If a distribution has two fairly equal high points, it is called a bimodal distribution. It is a distribution where two values occur with the greatest frequency. The graph resembles two humps on a camel’s back. Bi means two, so bimodal means two modes. Bimodal distribution is a distribution with two visible peaks or two frequent values that are separated by each other by a gap in between. Any bump in the data is a mode, so bimodal distribution has two distinct clear modes. The mode refers to the most frequently repeated number which is also the peak in the distribution. So, bimodal distribution has two most frequently repeated values in a distribution. The two modes are usually separated by a big gap in between and the distribution contains more data than others.
Difference between Unimodal and Bimodal Distribution
Definition
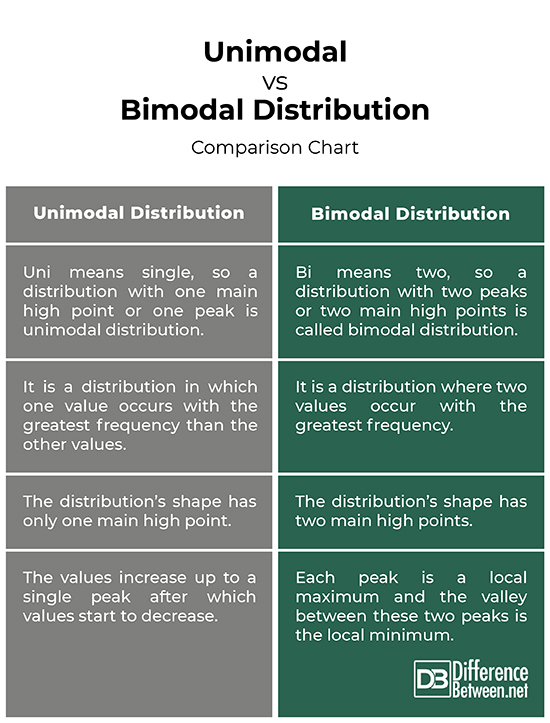
– The modality of a distribution can be either Unimodal or bimodal depending on the frequency of the occurring values. Unimodal is a single peaked distribution in that one value occurs with the greatest frequency than the other values. It is a distribution with a single clearly visible peak or a single most frequent value. Bimodal distribution, on the other hand, is a distribution where two values occur with the greatest frequency which means two frequent values are separated by a gap in between.
Shape
– The distribution’s shape in unimodal distribution has only one main high point. Sometimes the high point is in the center, while sometimes it peaks to the right or to the left. The high point is the most frequently observed value of the data and is refers to as the mode. Bimodal distribution, on the other hand, is a distribution that has two fairly equal high points (or the modes). The two modes are usually separated by a big gap in between and the distribution contains more data than others.
Example
– One of the best examples of unimodal distribution is the standard Normal Distribution which has a mean of zero and a standard deviation of 1. Other examples include chi-squared distribution, Cauchy distribution, exponential distribution, Student’s t-distribution, and so on. A real life example of bimodal distribution is the number of vehicles to cross the London Bridge by time of day. You can see peaks around rush hours, around 8 and 6, and fewer vehicles in between. You will notice multiple peaks if you put the number through a chart.
Unimodal vs. Bimodal Distribution: Comparison Chart

Summary
In a nutshell, unimodal distribution is a distribution that has only one peak or one main high point. It may be described as bell-shaped because it is the highest in the middle, and the shape of the bell slopes downwards as you move away from the top, just like a bell. One of the best examples of a unimodal distribution is a standard Normal Distribution. Bimodal, on the other hand, means two modes, so a bimodal distribution is a distribution with two peaks or two main high points, with each peak called a local maximum and the valley between the two peaks is called the local minimum.
- Difference Between Caucus and Primary - June 18, 2024
- Difference Between PPO and POS - May 30, 2024
- Difference Between RFID and NFC - May 28, 2024
Search DifferenceBetween.net :
Leave a Response
References :
[0]Tokunaga, Howard T. Fundamental Statistics for the Social and Behavioral Sciences. California, United States: SAGE Publications, 2015. Print
[1]Forbes, Catherine et al. Statistical Distributions. New Jersey, United States: John Wiley & Sons, 2011. Print
[2]Mukherjee, Chandan et al. Econometrics and Data Analysis for Developing Countries. Abingdon, United Kingdom: Routledge, 2013. Print
[3]Weinberg, Sharon L. et al. Statistics Using SPSS: An Integrative Approach. Cambridge, United Kingdom: Cambridge University Press, 2008. Print
[4]Violato, Claudio. Assessing Competence in Medicine and Other Health Professions. Florida, United States: CRC Press, 2018. Print
[5]Image credit: https://commons.wikimedia.org/wiki/File:Histogram_showing_bimodal_distribution._02.jpg
[6]Image credit: https://commons.wikimedia.org/wiki/File:Random_sampling_unimodal_function_(2).JPG
